


Welcome to our curated and vetted 2026 list of 30+ statistics on how social media affects travel.
Let’s make a start:
Top Social Media vs. Travel Statistics
- 78% of Americans admit that social media influencers prompted them to explore new destinations, restaurants, or attractions.
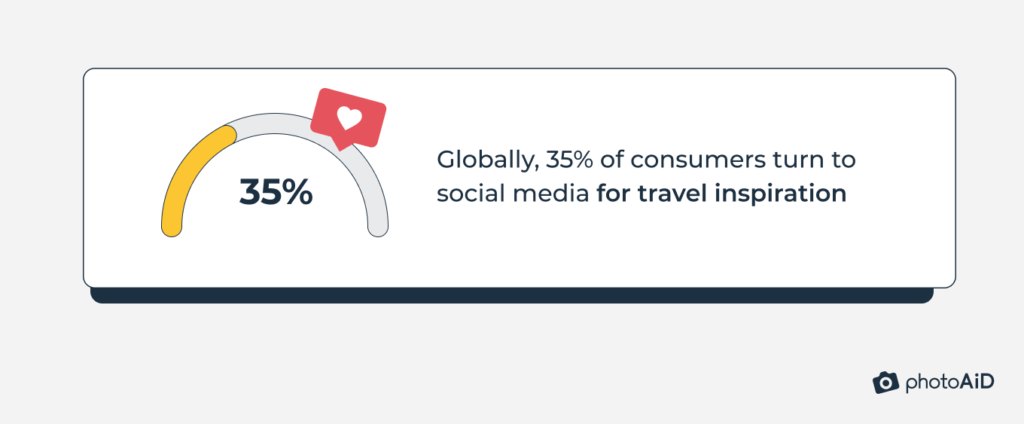
- Globally, 35% of consumers turn to social media for travel inspiration.
- 38% of Gen Zers and 28% of Millennials claim that social media has made them overspend on travel after seeing other users’ vacation photos.
- Nearly half (48%) of travelers visit places to flaunt them on social media.
Consumption Patterns and Preferences in Travel Content on Social Media
01. A majority of Americans choose Instagram (37%) as their top social platform for their travel needs.
| What’s Your Preferred Social Media Platform for Travel? | In % |
| 37 | |
| YouTube | 26 |
| 23 |
02. Activities and attractions (19%) is the type of travel information Americans typically search for on social media.
| What Travel Information Do You Typically Seek on Social Media? | In % |
| Activities and attractions | 19.13 |
| Transportation | 17.62 |
| Restaurants and dining | 17.08 |
| Reviews and recommendations from fellow travelers | 16.39 |
| Destination inspiration | 15.57 |
| Lodging | 8.2 |
03. The primary reason why social media users engage with travel content is for entertainment and vicarious experiences (42%).
| Reasons to Consume Travel Content on Social Media (in %) | Average | Women | Men |
| Entertainment and vicarious travel | 41.50 | 40.66 | 42.33 |
| Cultural insights and understanding | 21.45 | 19.23 | 23.66 |
| Practical advice (e.g., where to stay, what to do) | 19.91 | 21.15 | 18.67 |
| Inspiration | 14.66 | 17.31 | 12.01 |
04. A full 89% of Americans go on social media while on vacation.
05. People on vacation usually dedicate 1–2 hours to social media every day.
| How Much Time Do You Spend Daily on Social Media When on Vacation? | In % |
| 1–2 hours | 31 |
| 30–60 minutes | 24 |
| 2–3 hours | 20 |
| Less than 30 minutes | 14 |
| 3–4 hours | 6 |
| 4–5 hours | 3 |
| 6 hours or more | 2 |
06. A majority of Americans (58%) lament that their latest vacation was marred by excessive social media usage.
07. 92% of users say they trust brands more after engaging with them on social platforms.
08. Instagram is most used for travel planning among Millennials (33%), while TikTok leads among Gen Z (16%).
Sources: ePassportPhoto, Passport Photo Online #1, Passport Photo Online #2, Skift
Influence and Trust in Travel Influencers
09. A significant 78% of Americans admit that social media influencers prompted them to explore new destinations, restaurants, or attractions.
10. Most people (45%) have only moderate trust in content creators on social media.
| Social Media Users’ Trust Levels in Travel Influencers (in %) | Average | Gen Zers | Millennials | Gen Xers | Baby Boomers |
| Trust to some extent | 45.49 | 64.77 | 54.8 | 35.61 | 26.79 |
| Neutral / Neither trust nor distrust | 23.58 | 16.48 | 9.96 | 25 | 42.86 |
| Complete trust | 20.19 | 18.18 | 30.44 | 25 | 7.14 |
| Limited trust | 7.55 | 0.57 | 3.69 | 9.85 | 16.07 |
| No trust at all | 3 | 0 | 1.11 | 4.55 | 7.14 |
11. Roughly 59% of social media users have felt duped by a blogger’s travel advice at least once.
12. Information accuracy (25%) is Americans’ primary concern when considering travel recommendations from influencers on social media.
| What’s Your Top Concern about Influencer Travel Recommendations? | In % |
| Accuracy of information | 24.94 |
| Financial misrepresentation of costs | 18.32 |
| Lack of authenticity or filtered reality | 13.13 |
| Bias from sponsored content | 12.91 |
| Potential for a standardized or cookie-cutter experience | 12.69 |
| Omission of travel challenges or logistical details | 11.92 |
13. 56% trust booking links shared by influencers and creators.
14. 64% say influencers introduce them to new travel options they wouldn’t have found otherwise.
15. 73% believe brands partnering with trusted creators seem more authentic.
16. 12% of travelers joined loyalty programs due to influencer recommendations.
Sources: Passport Photo Online, Skift
Impact of Social Media on Travel Decisions and Experiences
17. Globally, 35% of consumers turn to social media for travel inspiration. For Gen Zers, this number jumps to 53%.
18. More people find travel inspiration from social media (35%) than from travel agents (29%), newspapers/magazines (26%), and TV shows/movies (25%).
19. Social media (75%) has the greatest influence on travel destination choices, ahead of TV/news/movies (64%) and family and friends (47%).
| Share of Respondents Influenced to Travel to a Destination by Channel | In % |
| Social media | 75 |
| TV, news, or movies | 64 |
| Family and friends | 47 |
20. The “travel” hashtag on TikTok has amassed over 44.5M posts and 296B views.
21. Six in 10 TikTok users have grown interested in visiting new places (e.g., parks, beaches, cities) after watching a video about them.
22. About 32% of people have booked stays at hotels or resorts they saw on TikTok.
| How Has TikTok Influenced Your Travel Decisions and Activities? | In % |
| Booked a stay at a new resort or hotel | 32 |
| Visited an attraction (e.g., waterpark, amusement park, aquarium) | 28 |
| Traveled to a new city | 18 |
| Traveled to a new beach | 18 |
| Visited a new state park, lake, or nature reserve | 15 |
| Attended a festival or state fair | 12 |
23. About 38% of Gen Zers and 28% of Millennials claim social media has made them overspend on travel after seeing other users’ vacation photos.
24. Nearly half (48%) of travelers visit places to flaunt them on social media.
25. 42% of travelers in France, Germany, Spain, and the UK use social media as their primary travel-planning source, ahead of official sites (14%) and search engines (8%).
26. 80% of consumers research products and services, including travel, on social media before making a purchase.
27. 64% of travelers in the US, UK, Indonesia, and Japan are comfortable booking trips directly through social media.
28. 53% feel fine booking expensive trips directly via social platforms.
29. 27% of US travelers were inspired by friends’ or influencers’ posts to take an adventure trip.
30. The social-commerce travel market for hotels, rentals, and airlines is worth about $7.0B.
Sources: Credit Karma, Expedia, MGH, Statista, Skift, TikTok Hashtags
Keep Exploring
Looking for more statistics? Check out these resources:
- Cruise Industry Statistics
- Mobile Photography Statistics
- Digital Nomad Statistics
- Airbnb Statistics
- Business Travel Statistics
- Vacation Rental Statistics
- Solo Travel Statistics

As a Digital PR specialist and a member of the Society of Professional Journalists (SPJ), I have 5+ years of writing experience.
Over the course of my career, my work has garnered significant attention, with features in numerous prominent publications such as The New York Times, Forbes, Inc., Business Insider, Fast Company, Entrepreneur, BBC, TechRepublic, Glassdoor, and G2.