


Taking a cruise should be a dream vacation.
But sometimes, little annoyances can turn that dream into a floating frustration.
To find out what really bothers passengers at sea, we surveyed 884 Americans about their cruise experiences.
Let’s dive into the results.
Key Takeaways
- The top three cruise annoyances are fellow travelers’ rude behavior (74%), high-cost drink packages (71%), and smoking or vaping in prohibited areas (70%).
- Nearly 81% of passengers rated their most recent cruise as good (39%) or excellent (42%).
- The most common post-cruise emotions are relaxed (34%), pleased (17%), and content (11%).
- The most popular cruise duration is 10–14 days (24%), followed by 4–6 days (22%) and 7–9 days (20%).
- Passengers most often cruise with friends (29%), partners/spouses (22%), or extended family (9%).
- Nearly 85% of Americans are likely (55%) or very likely (29%) to cruise again within the next 12 months.
Most Cruise Passengers Plan to Sail Again Within a Year
Before plunging into the grievances, we first wanted to understand the general sentiment toward ocean voyages.
To do it, we asked survey respondents to rate their most recent cruise.
Below are the results:
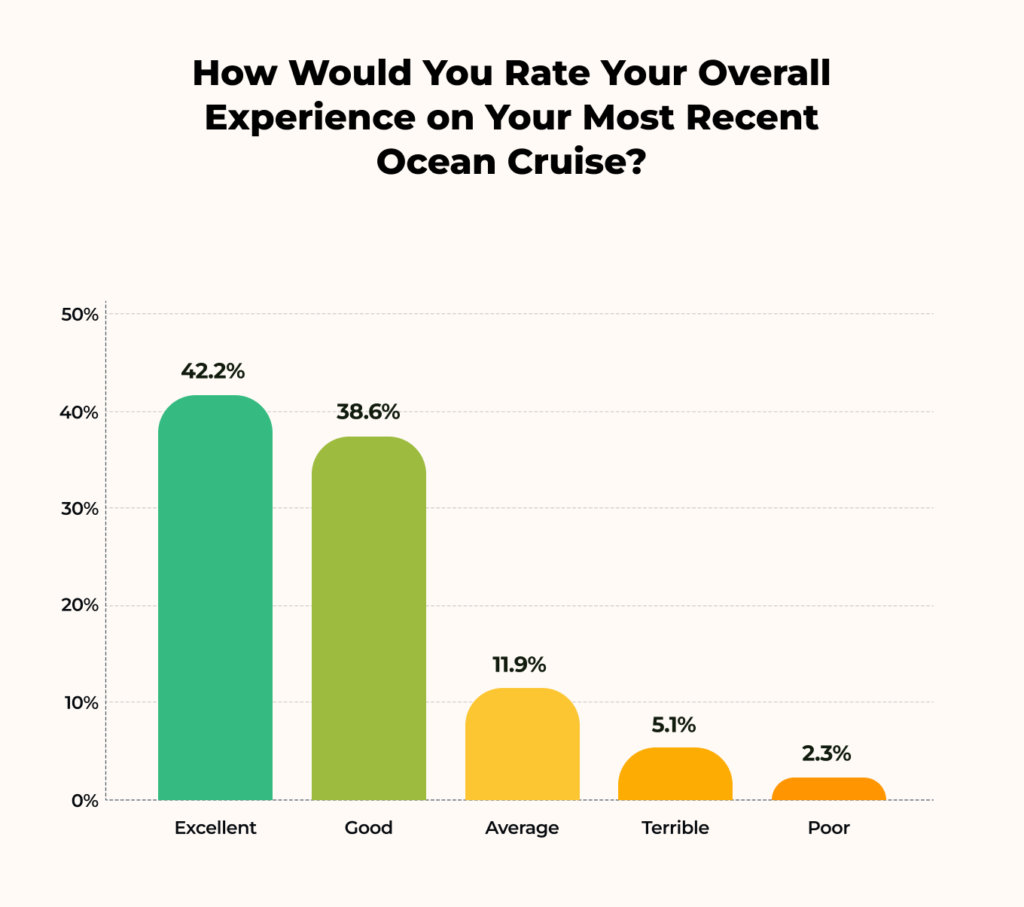
The majority of cruise passengers had a positive experience. A combined 81% rated their trip as excellent (42%) or good (39%).
Next, we wanted to get a better sense of whether the trip lived up to expectations.
So, we asked:
| Which Emotion Best Describes How You Felt After Your Most Recent Cruise? | In % |
| Relaxed | 33.8 |
| Pleased | 16.5 |
| Content | 10.5 |
| Ecstatic | 10 |
| Overwhelmed | 7.2 |
| Indifferent | 7 |
| Regretful | 6.4 |
| Frustrated | 4.4 |
| Disappointed | 2.7 |
| Don’t remember | 1.4 |
“Relaxed” (34%) was the most common response, reinforcing that cruises deliver on their promise of fun and relaxation. Other top emotions included “Pleased” (17%), “Content” (11%), and “Ecstatic” (10%).
Of course, not everyone left with a smile—6% felt “Regretful,” possibly due to an ambitious onboard shopping spree or one too many trips to the buffet.
We then asked respondents how many days their most recent cruise lasted, including embarkation and disembarkation.
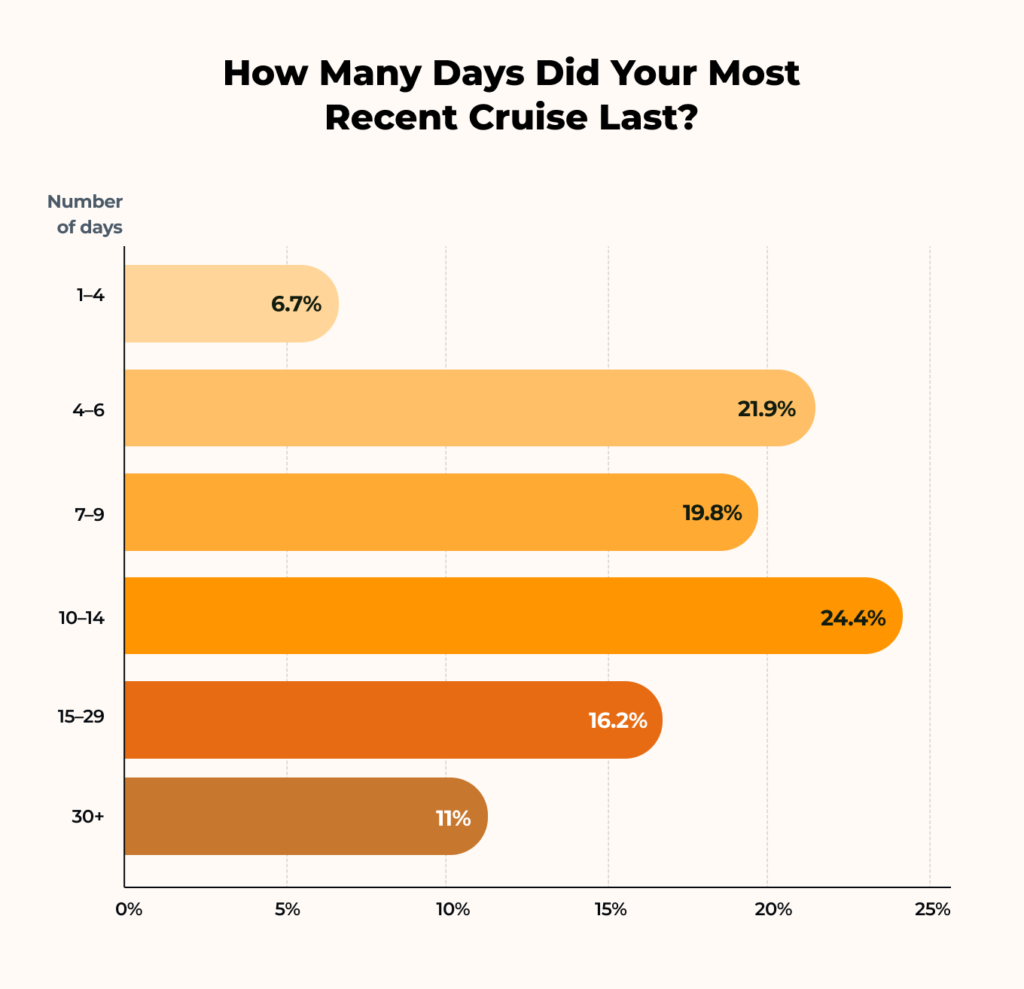
The most common duration was 10–14 days (24%), followed by 4–6 days (22%) and 7–9 days (20%).
Together, mid-length cruises (4–14 days) accounted for 66% of trips, likely balancing cost, itinerary variety, and vacation schedules. Longer voyages also had a steady following, with 16% lasting 15–29 days and 11% stretching to 30+ days. Shorter trips under four days were less common (7%), possibly due to limited itineraries or perceived value.
As our penultimate question for this segment, we asked passengers about their cruise companions:
| Whom Did You Travel with on Your Most Recent Cruise? | AVG | Men | Women |
| Friends | 29 | 28.44 | 30.38 |
| Partner/Spouse | 22.3 | 17.31 | 35.86 |
| Extended family (e.g., siblings, cousins, in-laws) | 9.3 | 10.66 | 5.49 |
| Colleagues or work group | 9.2 | 10.2 | 6.33 |
| Group tour or organized travel club | 8 | 8.81 | 5.91 |
| Immediate family with adult children (18+) | 6.7 | 7.26 | 5.06 |
| Multi-generational family (e.g., grandparents, parents, and children) | 6.6 | 6.8 | 5.91 |
| Immediate family with children (under 18) | 4.9 | 5.87 | 2.11 |
| Solo | 4.2 | 4.64 | 2.95 |
Friends were the most common response at 29%, followed by partners or spouses (22%).
Interestingly, women were more likely to cruise with a partner (36% vs. 17%), while men were more likely to travel with extended family (11% vs. 5%). Solo travelers made up just 4%, suggesting cruises may not be the top choice for those seeking a retreat on their own.
Finally, we asked passengers how likely they were to go on another ocean cruise within the next 12 months.
Below are the results:
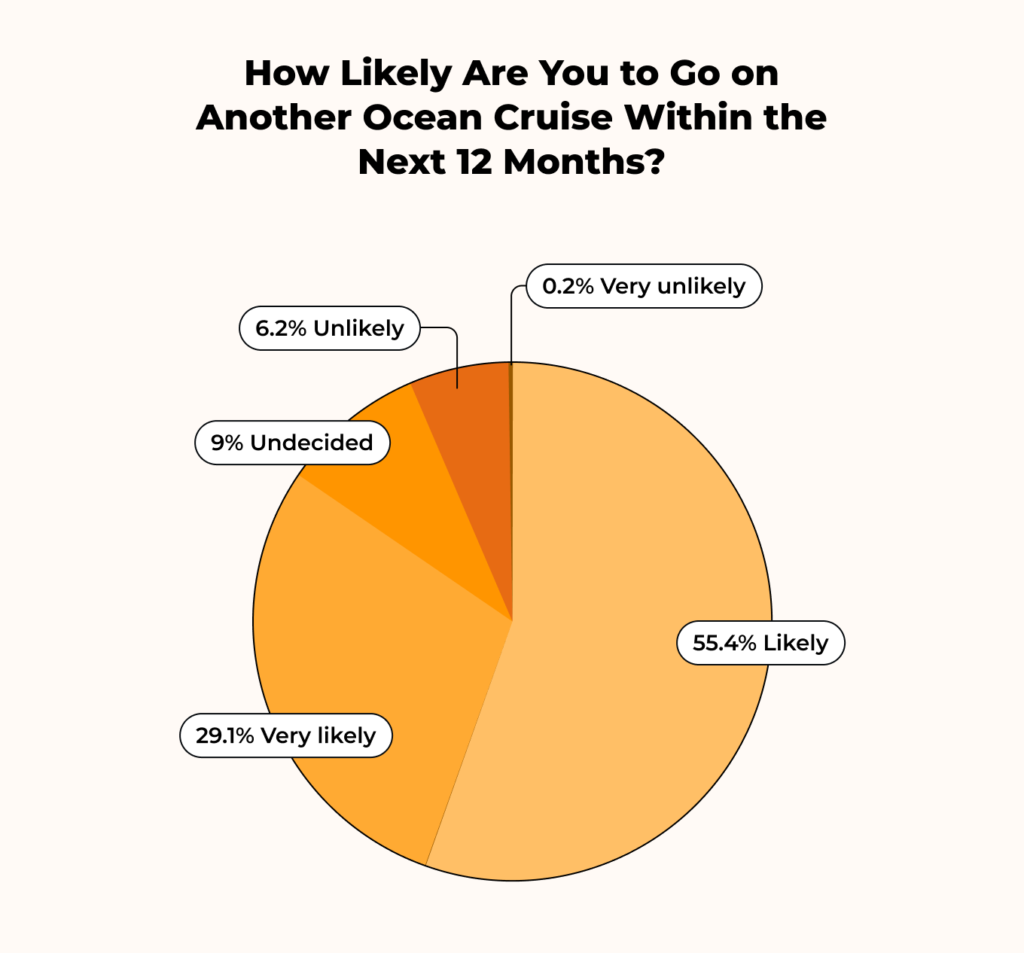
More than 84% said they were likely (55%) or very likely (29%) to cruise again within a year. Only 6% said they were unlikely to return anytime soon.
Overall, cruising continues to be a go-to vacation choice for many.
But—while most are eager to sail again, not every part of the experience is hassle-free.
Rude Behavior From Fellow Travelers Is Cruisers’ Top Annoyance
To uncover the most common cruise frustrations, we analyzed hundreds of complaints scattered across the internet, distilled them into 24 key issues across four categories, and asked respondents to weigh in.
Let’s take a look at the results:
| Ocean Cruise Annoyance | In % |
| Rude or inconsiderate behavior (e.g., drunkenness, loud arguing, inappropriate attire in dining areas) | 73.6 |
| High-cost drink packages | 70.7 |
| Smoking or vaping in prohibited areas | 69.7 |
| Expensive onboard essentials (e.g., sunscreen, toiletries, medication) | 69.3 |
| Hidden fees and mandatory charges (e.g., gratuities, service fees, port taxes) | 69.3 |
| Line cutting (e.g., buffets, excursions) | 69.2 |
| Long lines for tender boats at ports without docking facilities | 69.2 |
| Unsanitary habits (e.g., not washing hands before buffets, coughing without covering) | 68.4 |
| Long waits for seating at buffets or specialty restaurants | 68.4 |
| Difficulty securing reservations at specialty dining venues | 68.3 |
| Busy buffets and dining rooms during peak meal times | 68.1 |
| Limited seating on sun decks | 67.9 |
| Excessive public displays of affection (PDA) making others uncomfortable | 67.5 |
| Chair hogs (reserving pool chairs for hours without using them) | 67.2 |
| Crowded ports, especially when multiple ships dock simultaneously | 67.2 |
| Overpriced shore excursions | 67.1 |
| Unsupervised or disruptive children (e.g., running in hallways, yelling) | 66.6 |
| Loud talking or phone calls in quiet zones (e.g., lounges, theaters) | 66.5 |
| Strict beverage policies (e.g., limited alcohol carry-on allowances) | 66.5 |
| Extra charges for specialty dining (e.g., steakhouses, sushi, premium restaurants) | 66.2 |
| Overcrowding in hot tubs or pools beyond posted limits | 66.2 |
| Full theaters and entertainment venues with limited or no seating | 66 |
| Poor elevator etiquette (e.g., not letting others exit before entering, crowding in) | 65 |
| Subpar or bland food quality in main dining rooms | 63.3 |
The biggest complaint was fellow passengers’ rude or inconsiderate behavior (74%). Examples of this include loud arguing, inappropriate attire in dining areas, and excessive drunkenness.
High onboard costs were another major frustration. Many passengers pointed to:
- Expensive drink packages (71%)
- Overpriced essentials (69%)
- Hidden fees and mandatory charges (69%)
- Overpriced shore excursions (67%)
- Extra charges for specialty dining (66%)
Overcrowding was yet another pain point. Long waits for seating (68%) and difficulty securing reservations (68%) left many passengers frustrated, while busy buffets during peak hours (68%) made mealtime feel more like a competitive sport than a relaxing experience.
Beyond dining, limited space in high-traffic areas was a common complaint. Crowded ports (67%) and overbooked sun decks (68%) meant prime relaxation spots were often taken. Pools and hot tubs weren’t much better, with 66% saying they were overcrowded.
Adding to the frustration, some passengers seemed to forget basic etiquette in shared spaces, with many guilty of:
- Chair hogging (67%)
- Loud talking in quiet zones (67%)
- Poor elevator etiquette (65%)
Cleanliness (or lack thereof) was a key issue, too. Unsanitary habits (68%)—such as not washing hands before buffets—ranked high on the list.
Yikes.
Stacking It All Up
While cruises offer plenty of perks, certain annoyances can dampen the experience.
At the end of the day, we found that fellow travelers’ inconsiderate behavior, costs, and overcrowding are the top frustrations among cruise passengers.
Now—
Have you encountered any of these cruise pet peeves, or is there another one that really marred your experience?
We’d love to hear your thoughts!
Keep Exploring
Curious about more travel research? See these next:
- America’s Most Common Travel Mistakes
- Why Film Tourism Is in Vogue
- Do Americans Want Airlines to Offer Adult-Only Flights?
- Falling for the Hype? How to Evade Tourist Traps
- Unwrapping America’s Christmas Travel Plans
- Airbnb’s Top Pet Peeves: What Irks Guests Most
- Air Travel Tensions: Who Gets the Seat?
Methodology
In late 2025, we conducted an online survey with 884 respondents from the United States using a custom online polling tool. Among the participants, 73.2% identified as male, while 26.8% identified as female. Age distribution was as follows: 32.2% were 28 years old or younger, 63.5% were between 29 and 44, 4% were aged 45 to 60, and 0.3% were 61 or older.
The survey was designed with a 95% confidence level and a 3% margin of error. Considering the gender and age distribution of the sample, the study’s results are statistically significant for the general population.
This research involved multiple methodological steps, including crowdsourcing and surveying. To ensure data integrity, data scientists reviewed all responses for quality control. Additionally, the survey included an attention-check question.

As a Digital PR specialist and a member of the Society of Professional Journalists (SPJ), I have 5+ years of writing experience.
Over the course of my career, my work has garnered significant attention, with features in numerous prominent publications such as The New York Times, Forbes, Inc., Business Insider, Fast Company, Entrepreneur, BBC, TechRepublic, Glassdoor, and G2.