Welcome to our curated and vetted list of business travel statistics.
Let’s dive right in:
Top Business Travel Statistics
- In 2024, the global business travel market was worth $1.63T, and it’s expected to grow to $2.75T by 2030, with a 9.1% CAGR between 2024 and 2030.
- Global business tourism spending reached an estimated $1.57T in 2025, and it’s forecast to surpass $2T in 2029.
- It’s estimated that US travelers took 470M domestic business trips in 2025.
- Business travelers typically take about 1.8 trips per month.
- Attending business meetings and events costs corporate travelers $160 per person daily.
- Business travelers from US-based companies typically spend $1,771 per trip. For decision makers, this figure rises to $1,986.
Business Travel Volume and Frequency
01. It’s estimated that US travelers took 470M domestic business trips in 2025.
| US Domestic Business Trips: 2019–2022 Data and Projections Through 2026 | In Billions |
| 2019 | 0.46 |
| 2020 | 0.18 |
| 2021 | 0.25 |
| 2022 | 0.37 |
| 2023* | 0.41 |
| 2024* | 0.45 |
| 2025* | 0.47 |
| 2026* | 0.48 |
02. In 2026, the US is expected to see a 3% increase in domestic business trips compared to the previous year.
| US Domestic Business Trip Growth: 2017–2026 | In % |
| 2017 | -0.10 |
| 2018 | 1.20 |
| 2019 | 1.10 |
| 2020 | -61 |
| 2021 | 38.10 |
| 2022 | 48.40 |
| 2023 | 11.60 |
| 2024 | 8 |
| 2025 | 4.90 |
| 2026 | 3 |
03. Business travelers typically take about 1.8 trips monthly.
| US Business Travelers’ Average Monthly Trips by Type | Share |
| Internal meetings | 0.6 |
| Customer and stakeholder meetings | 0.7 |
| Conferences and trade shows | 0.5 |
| Total | 1.8 |
04. Business travelers from US-based companies typically spend $1,771 per trip. For decision makers, this figure rises to $1,986.
Sources: Booking, GBTA, Statista, US Travel Association #1, US Travel Association #2
Global and Regional Business Travel Spending
05. In 2024, the global business travel market was worth $1.63T, and it’s expected to grow to $2.75T by 2030, with a 9.1%% CAGR between 2024 and 2030.
06. Global business tourism spending reached an estimated $1.57T in 2025, and it’s forecast to surpass $2T in 2029.
07. Global business travel spending will rise by 5.2% in 2026.
| Change in Expenditure of Global Business Tourists: 2017–2022 and Projections through 2026 | In % |
| 2017 | 5.80 |
| 2018 | 5.70 |
| 2019 | 1.50 |
| 2020 | -53.80 |
| 2021 | 5.50 |
| 2022 | 33.80 |
| 2023 | 24.20 |
| 2024 | 12.20 |
| 2025 | 7.70 |
| 2026 | 5.20 |
08. In 2024, China’s business travel spending was expected to hit $373B.
09. Though just 20% of trip volume, business travelers represent 40–60% of air and lodging revenue in the travel industry.
10. Business travel directly supports 1.3M jobs.
11. Amazon bought about $483M worth of airline tickets in the US in 2023.
12. The global meetings industry is expected to reach around $1.49B by 2026.
| Global MICE Industry Size: 2019–2030 | In Billion USD |
| 2019 | 0.92 |
| 2020 | 0.84 |
| 2021 | 1.13 |
| 2022 | 1.20 |
| 2023 | 1.27 |
| 2024 | 1.35 |
| 2025 | 1.42 |
| 2026 | 1.49 |
| 2027 | 1.56 |
| 2028 | 1.64 |
| 2029 | 1.71 |
| 2030 | 1.78 |
Sources: Allied Market Research, Business Travel News, GBTA, Next Move Strategy Consulting, Statista #1, Statista #2, US Travel Association
Costs and Expenditures in Business Travel
13. Attending business meetings and events costs corporate travelers $160 per person daily.
14. The average business airfare ticket price is around $705.
15. The global average daily hotel rate for business travel is $165.
16. In Q4 2024, New York became the world’s most expensive city for business tourism, with an average daily cost of around $660.
17. In 2024, New York was the US’s most expensive city for business travel in terms of car rental costs, with the average daily car rental rate amounting to nearly $74.
Sources: Business Travel News #1, Business Travel News #2, Skift
Corporate Travel Policies
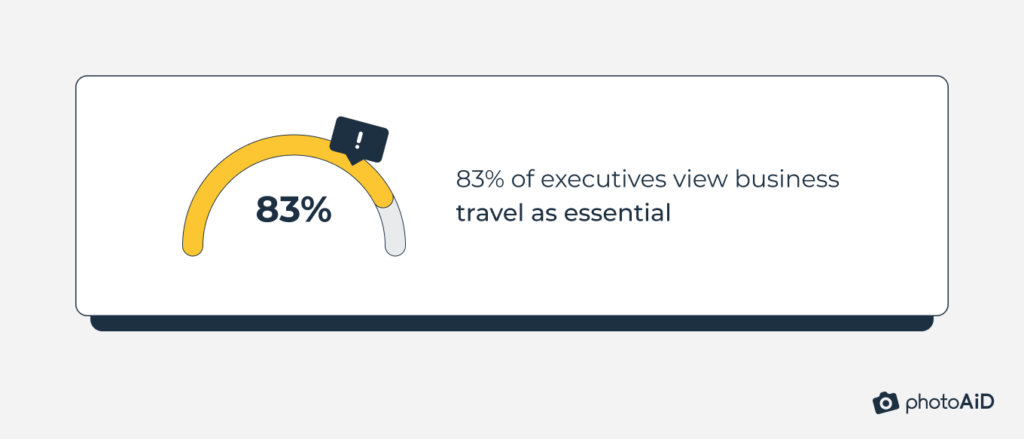
18. 83% of executives view business travel as essential.

19. Over a third (38%) of workers believe business travel is crucial for keeping abreast of the latest trends, technology, and advancements.
20. 62% of global business travelers feel they’ve lacked equal business travel opportunities compared to their colleagues, often due to factors such as age, accent, or gender.
21. 35% of executives feel reduced business travel hinders their company’s competitive edge.
22. About 46% of corporate execs cite critical relationships as the top factor in authorizing travel for client visits.
| Top Non-monetary Factors in Travel Authorization for Customer Visits, as per Corporate Executives | In % |
| Critical customer, supplier, or other stakeholder relationship(s) | 46 |
| Ability to meet with multiple customers or suppliers at once | 44 |
| Customer, supplier, or other stakeholder is located within driving distance of the employee | 41 |
| Customer, supplier, or other stakeholder is located where there are many direct flight options | 36 |
| Introducing a new product or service | 35 |
| Length of time since prior in-person meeting | 27 |
| Closing sales | 26 |
| Adequate seat availability on flights to the customer, supplier, or other stakeholder location | 25 |
| Other | 3 |
23. Budget constraints within the company or department (36.5%) are the leading factor for restricting business travel.
24. The top reasons for business travelers skipping or calling off air trips for customer visits were the total flight time (40%) and the risk of delays or cancellations (26%).
25. Most executives (75%) favor employees extending business trips for leisure, with 86% endorsing remote work from anywhere.
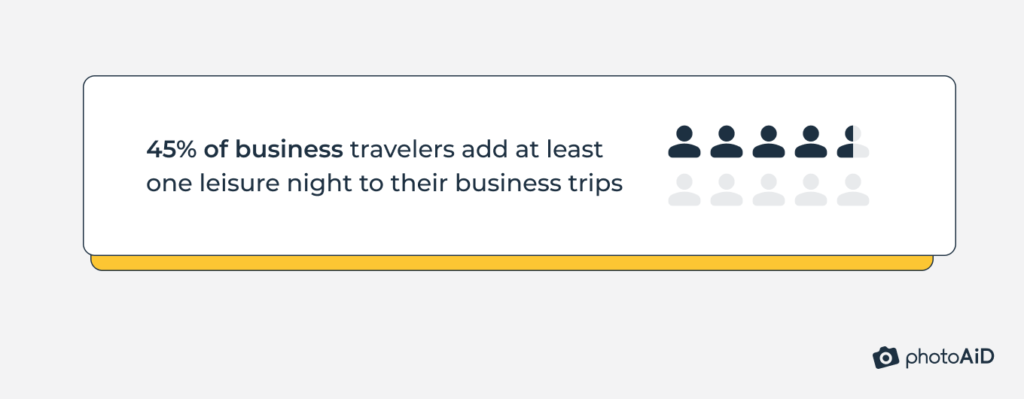
26. Nearly half (45%) of business travelers add at least one leisure night to their business trips.

27. The main reason for extending business trips for leisure is exploring the destination (36%), followed by already-paid transport costs (31%).
28. Almost half (48%) of business travelers choose their own booking platforms.
| Common Booking Practices Among Business Travelers | In % |
| I book on a platform of my choice | 48 |
| I book via a company platform | 27 |
| Someone else books for me | 25 |
29. Two-thirds (66%) of business travelers worldwide receive a corporate credit card from their company.
30. About 64% of business travelers with a corporate card add it to a mobile wallet.
31. Most (91%) business travelers would refuse an assigned trip if it conflicted with their needs, values, and preferences.
Sources: GBTA, SAP News, US Travel Association
Keep Exploring
Looking for more statistics? Check out these resources:
- Cruise Industry Statistics
- Statistics on How Social Media Affects Travel
- Digital Nomad Statistics
- Airbnb Statistics
- Vacation Rental Statistics
- Solo Travel Statistics

As a Digital PR specialist and a member of the Society of Professional Journalists (SPJ), I have 5+ years of writing experience.
Over the course of my career, my work has garnered significant attention, with features in numerous prominent publications such as The New York Times, Forbes, Inc., Business Insider, Fast Company, Entrepreneur, BBC, TechRepublic, Glassdoor, and G2.


